Jay L. Epstein
Higher Education + Esports | Market Leader
Principal
Wireless data is everywhere. It’s virtually impossible for the modern professional to get a rest from receiving or sending emails, photos, videos, reports, spreadsheets. But, this constant on-the-go streaming of data lies at the mercy of the availability and quality of your WiFi network.
There’s only one thing more frustrating than suddenly losing your WIFI connection—not having it in the first place. If you’re ever stuck in the middle of airport wondering how it’s possible in this day and age to suddenly find yourself without the internet of things (IOT) right at your fingertips, please remember that moment—especially if you are in the A/E/C industry. Designers, you can help prevent this frustration from happening! One of the most common reasons for a sudden drop in WiFi access boils down to not enough antenna coverage.
When the reason for poor wireless internet signal is from limited coverage, an on-site survey can be enough to identify where these dead zones live. Of course, adding the needed wireless access points (WAPs) come at a cost—especially if you need to tear up walls, add more cabling, and purchase the devices themselves (commercial WAPs often go for over a thousand bucks a pop!). But, what if I told you there was an easier way to design a network besides putting in a cluster of WAPs and crossing your fingers? What if there was a way to use predictive modeling to figure out how to get the best coverage while using the fewest amount of WAPs possible? Well, there is. At Acentech, I have helped many clients predict WiFi coverage in new and renovated buildings by using predictive modeling software.
When planning a deployment of a wireless network, a predictive modeling survey can plan the right location of the access points. This is an effective way of controlling costs so you have what’s needed at the right time and contractors aren’t suddenly needed back on site after building is completed. Or, in some environments, when money is no object, there’s a tendency to buy more Some may believe the solution to WIFI coverage is as easy as, “just give me the locations and we’ll add them to the floor plans—we’ll provide network drops based on a predetermined amount of square feet.” If only it were that simple! Building materials, complicated floor plans, and client expectations are all critical factors in how to set up a wireless network. Assuming it all comes down to square footage is how you end up with that problem I mentioned earlier—sitting at a bar, hoping to connect to your email, and praying to the WiFi gods for mercy.
One of the earliest markets to advocate for wireless network design was higher education. After introducing WiFi in residence halls universities tracked how students started to use the data, noticing a drop in wired data vs. wireless usage year after year. This data analysis revealed that updates to their residence halls were going to require robust WiFi coverage to keep up with the demands of those living on campus. As those students started to trickle into the workforce, the need for wireless everywhere—not just on college campuses—became more and more apparent to all markets.
The ability for universities to keep up with the surge in wireless demand is no mystery. They knew to plan ahead when it came to WiFi network design—just like in any successful project. The first step is a programmatic meeting with the owner’s IT department. Collecting the programmatic information at the beginning of the design is critical to understanding the needs, capabilities, and expectations of this network. Then, with predictive modeling software, we’re able to model the buildings’ characteristics. This includes one hour walls, two hour walls, mechanical and plumbing chases, concrete walls and foundations, block walls, glass walls, metal doors, wood doors—the list goes on. Each of these possible components to a building can impact WiFi reception within a given room. For instance, two hour rated walls (more gypsum) and metal materials tend to block more signal, while one hour rated walls (less gypsum) and wooden materials tend to be more forgiving. Glass, depending on what type, can impact how far a WiFi signal can reach. An often overlooked aspect to energy efficient glass that uses a thin metallic layer to improve indoor comfort is that it can act as a barrier for WiFi. Due to the properties of this high-tech glass, it has the capability to block wireless signals. Like I said, this process isn’t as simple as square footage and simple math!
When developing wireless heat maps, one must first start with a floor plan. Using this drawing, the building materials for the facility in question are assigned a decibel attenuation value. This value changes in color according to the materials’ abilities to block WiFi signal. For example, thick concrete—a notorious blocker of WiFi signal—would be given a different color than something less substantial, like a demountable wall. These statistical values are then traced on top of the floor plan, and typically looks like this when finished:
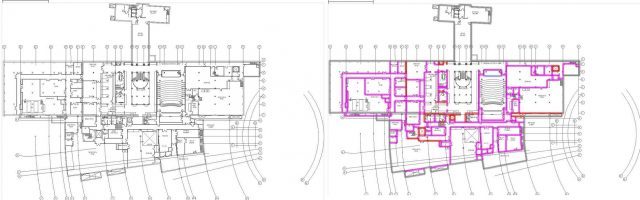
Left: A floor plan before it is entered into the wireless heat mapping program
Right: The same floor plan with the building’s infrastructure outlined according to its effects on WiFi signal.
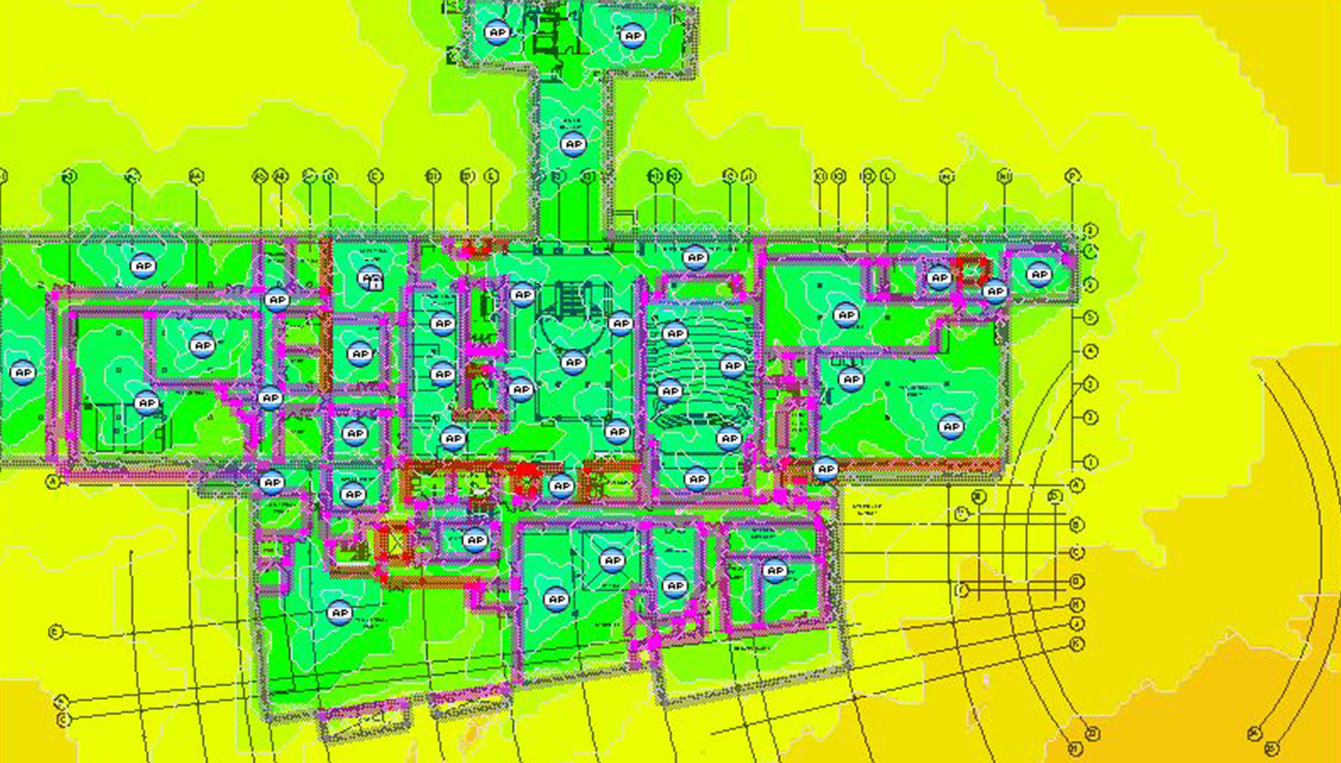
Once the infrastructure is put into place, the fun begins—it is finally time to place the WAPs onto the drawing and give this map some heat! As with any piece of technology, different brands’ devices have different strengths and weaknesses. The specifications of the antennae used within the WAPs selected for this project are then uploaded into the program to ensure accuracy. With this software, we’re able to create a colored heat map illustrating the device’s radio frequency energy, how it travels, and where the loss of signal happens. Where the coverage begins to weaken, we place the next WAP in an engineered, systematic order rather than all the guess work mentioned earlier. WAPs within this program are depicted as numbered circles, as seen in the following image:
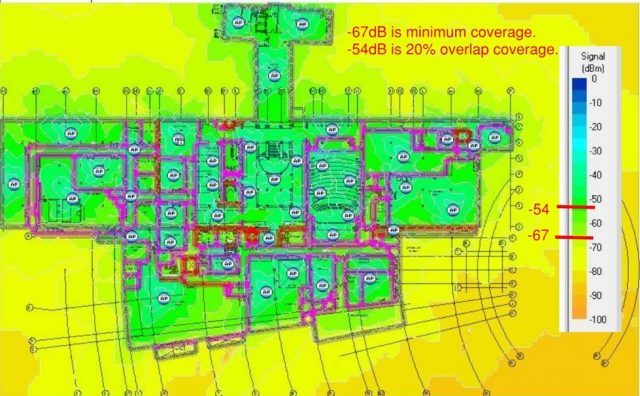
Above: A completed wireless heat map in all its glory! Note: the ideal signaling for WiFi should be between -54 and -67dB at the absolute minimum.
As you can see in the above example, the interior of this building is a bright, bluish hue, indicating robust WiFi signaling throughout the facility. Thanks to wireless heat maps, we no longer have to cross our fingers when it comes to WiFi coverage—which frees up our digits to keep scrolling, swiping, and tapping along with the rest of the internet.

"I find my role at Acentech very satisfying. Our projects are usually the most exciting and interesting projects in my career. I admire leaders and innovators who persevere and beat the odds. I work with design teams from around the world and my colleagues are some of the most talented, respected people in the business.”
 Articles
Principal Consultant and acoustician Ioana Pieleanu was recently interviewed by Nick Pipitone of Propmodo on the importance of acoustical design in today’s office environments. You can…
 Articles
With the recent increase in Esports’ technological advancements and funding, higher education institutions are racing to offer Esports to all students and provide a fun location…
 Articles
[with apologies to Charlie Parker and David Foster Wallace] Chasin’ the Bird Acentech’s role as consultants gives us the opportunity to interact with brilliant thinkers, sincere…
