Ethan R. Brush
Energy, Environmental, Transportation |
Market Co-Leader
Principal
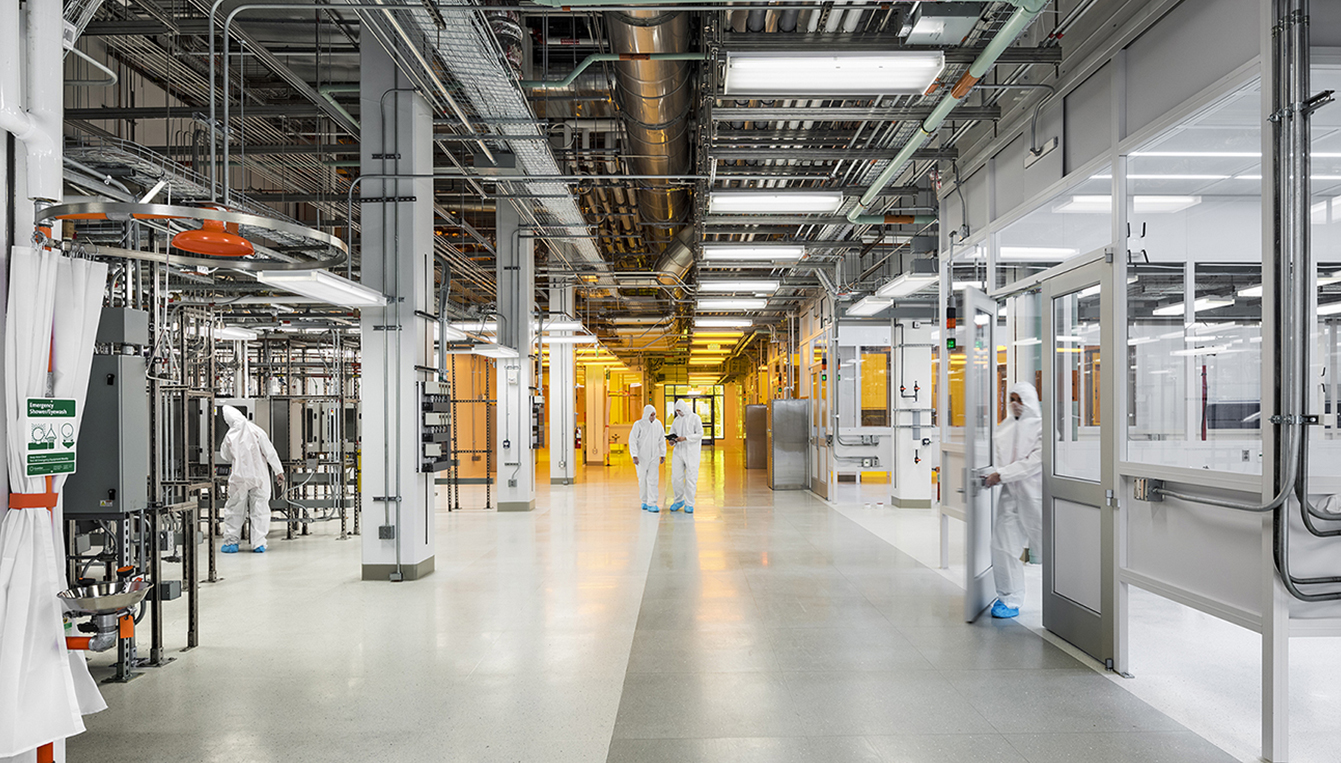
Maintaining a low vibration environment can be a big part of what makes a cleanroom “clean”. Equipment used in a wide variety of applications is sensitive to vibration, making it necessary to establish limits of acceptability for them in order to maintain the proper environment. Unacceptably high vibrations in a sensitive area can place severe limits on many important processes. Parameters such as air quality, temperature, and humidity, are continuously monitored in cleanrooms and other advanced technology facilities to assess the performance of the environment. At Acentech we work with clients to consider building vibration as another important environmental variable to understand and to monitor.
The ability to measure and quantify floor vibration is important. The renowned mathematician and physicist Lord Kelvin is famously quoted as saying “when you can measure what you are speaking about, and express it in numbers, you know something about it; but when you cannot measure it, when you cannot express it in numbers, your knowledge is of a meagre and unsatisfactory kind”. This quote, and similar quotes from other successful scientists and leaders, essentially boils down to “If you cannot measure it, you cannot improve it”.
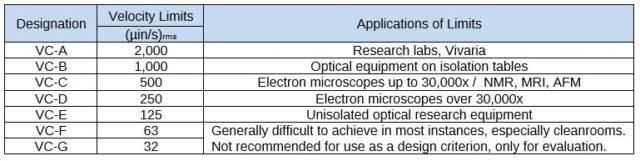
Vibrations are measured in cleanroom areas for a variety of reasons over the lifetime of a facility. Measurements may happen as part of a facility’s site selection, during nearby construction, and throughout the productive life of the facility. Unless there are specific equipment criteria involved the data is usually compared to the generic vibration criterion (VC) levels. The following Table 1 outlines the vibration amplitudes for the VC designations and some of the applicable limits for each tier. Several Acentech consultants were involved with the development of these criteria, which were borne out of the need for characterizing low vibration facilities as semiconductor fabrication plants became more widespread. These limits are also sometimes referred to as the “BBN” curves, as they were conceived before Acentech was incorporated and still part of the pioneering firm Bolt Beranek and Newman.
Once a facility has been built, the owner may choose to test the building to assure that it meets all of the original design criteria. These criteria are unique to each facility, based on room use and the intended instruments and processes. The certification will occur after the new space is fully built when all systems (HVAC, lighting, load bank, etc.) are operating. The designated sensitive tools and processes have been chosen, but are not yet installed at the time of certification.
A specialty lab facility that wants to “certify” their spaces will hire a consultant to develop a performance testing specification document that details how to test each prescribed criteria. The measurements may include temperature, humidity levels, particulate levels, EMI, sound, and vibration. Most cleanroom performance testing specification documents cite the Institute for Environmental Standards and Technology (IEST) recommended practice for measuring vibration in microelectronics facilities and also the National Environmental Balancing Bureau’s document “Procedural Standards for Certified Testing of Cleanrooms”.
Certifying a cleanroom essentially verifies that the design parameters for the space are met and that the sensitive instruments will be able to function. Any unacceptably high vibration levels must be found and mitigated before proceeding with final installation and operation of sensitive activities. Implementing vibration mitigation after final installations can be very costly and sometimes virtually impossible.
Cleanrooms and advanced technology facilities are often constructed in urban environments or campus settings where there are potentially many adjacent sources of vibration. Disruptions and downtime due to nearby construction projects are possible, even from vibrations well below the threshold of human perception. This concern has been increasing in recent years as there are a growing number of sensitive equipment items and often an economic penalty associated with interruption of critical activities. In some cases, it is desirable to monitor vibration continuously during the entire construction process. For example, animal laboratory managers are interested in documenting the long term environmental conditions in vivaria, since changing patterns of sounds and vibration in animal research laboratories have been linked to adverse physiologic effects in certain species. Researchers also are keen on determining whether extraneous events may be responsible for spurious data.
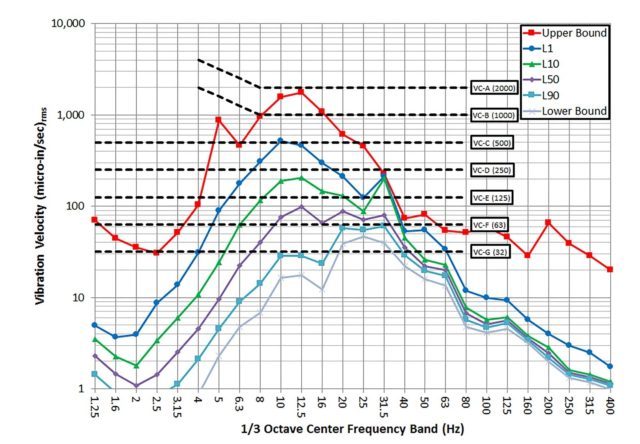
The availability of real-time information from continuously monitoring in laboratories makes it possible to have appropriate personnel notified immediately if vibrations or noise from a particular construction activity exceed a threshold limit in an area of concern so that the appropriate actions can be taken rapidly. Figure 1 presents vibration data measured from a monitoring system over a 24 hour period compared to the VC levels listed in Table 1. The chart shows statistical levels of the 1/3 octave frequency spectra (frequency distributions). The upper and lower bounds are simply the greatest and smallest amplitudes for that day. The levels in-between represent amplitudes that were exceeded a certain percentage of the time. For example, the L1 curve represents the vibrations that were exceeded only 1 percent throughout the day (i.e. the 99th percentile). This means that the environment stayed below a VC level of VC-C for 99 percent of the measurement period, and the maximum levels stayed below VC-A.
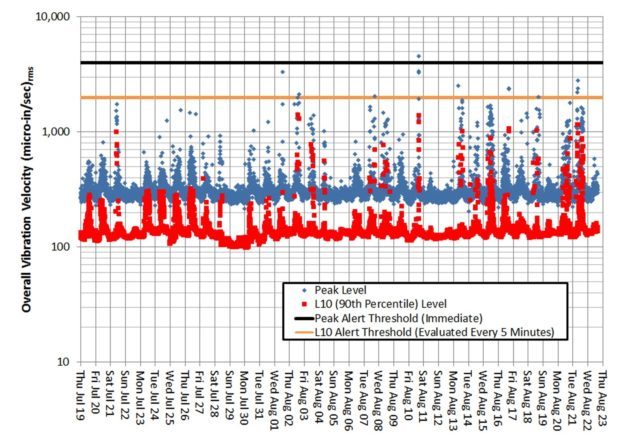
Figure 2 presents how vibration monitoring data can be viewed in a historical manner over a longer period of time. The greatest upper bound and L10 (90th percentile) amplitudes for this project are saved every 5 minutes and plotted versus time and then each metric is compared to project-specific alert criteria. Inspection of the chart shows that only one 5-minute period experienced a peak level above the limits. This entire months’ worth of data indicates that even the highest vibrations were well below feel-able thresholds for humans, which is on average about 8,000 micro-inches/second.
Availability of real-time building vibration data such as this allows lab personnel and facility managers to know exactly what the condition is of their sensitive spaces and to respond quickly to activities that threaten the functionality of their specialty processes. A historical record of building vibration performance can also be used by researchers to investigate data anomalies in the same way that many other environmental variables are examined. Furthermore, it promotes the type of communication needed to keep a low vibration building performing as such. As researchers move into new or renovated spaces they bring all of their support equipment with them and the potential for creating offending vibrations for other neighboring researchers in the building. For this reason, a number of prominent university science facilities have employed permanent vibration monitoring systems for their buildings as a way to guard against unknowingly introducing problems throughout the life of the facility.
“I really enjoy the technical aspect of my work, and I love using math and science to calculate an outcome and then test those predictions in the real world. My mechanical engineering education and noise and vibration experience in the aerospace industry prepared me well for joining Acentech.”
 Articles
How do you design a multi-use high school building where learning and performances aren’t disrupted, even when a train runs through it? Brookline High School’s 22…
 News
News
Acentech worked on an astounding 30 projects that are being toured at the AIA25 Conference on Architecture in Boston next month! We had a great time…
 Articles
Methods for storing energy have been employed for decades in the form of pumped hydroelectric reservoirs, compressed air, or via thermal energy transfer. Today we can…

